

ESXTOP is an utility bundled with ESXi allowing to monitor/troubleshoot performance of network, CPU or storage. This post is about storage performance troubleshooting with ESXTOP. Se will focus on storage as many times the storage is the main problem of latency. A weakest performance element in the whole chain. VMs performs slowly, but where the latency comes from? Is it at the VM level, LUN level or Disk level (hba). While ESXTOP is command line utility, note that there is a nice free tool which has GUI, from VMware called Visual ESXTOP. It integrates into vSphere web client.
What to monitor/troubleshoot?
- Per LUN
- Per VM
- per Disk (HBA mode)
Let’s monitor a LUN with ESXTOP
- Start ESXTOP and press U to switch to disk view (LUN mode)

- PressF (Field Order) to modify fields which you want to display. Then hit Enter to validate
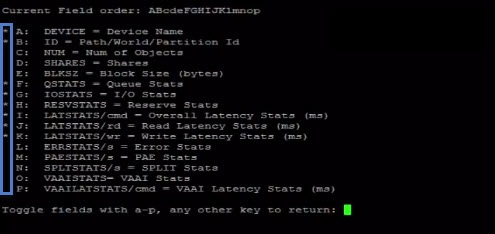
- PressS and then 3 (or other smaller/bigger value) to set the auto-update time to every 3 seconds…. In order to view the whole device name (the complete naa identifier) you’ll have to enlarge the column pres Shift + L and enter “32”. (or other larger number)

Let’s try to monitor Disk View (hba mode)
- Start ESXTOP utility and press D to switch to Disk view (hba mode). In order to view the whole device name (the complete naa identifier) you’ll have to enlarge the column pres Shift + L and enter “32”. (or other larger number).
- From here you can hit F(Field Order) to modify fields which you want to display. (You can see small star diplayed next to each visible field). When OK, you can hit Enter.
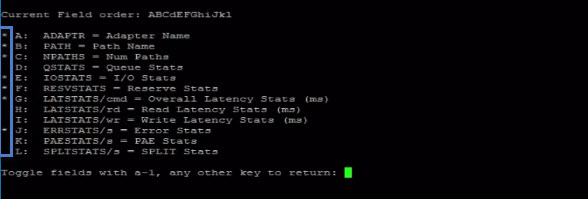
- Press S and then 3 to set the auto-update time for 3 sec. (you can enter smaller/bigger value as you wish).

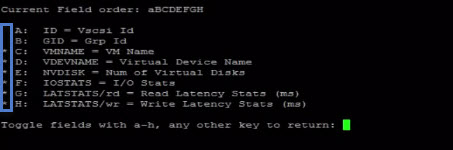
Monitor VM performance (Per VM)
1. Start ESXTOP and press V to switch to disk view.

2. Again, Press F (Field Order) to modify fields which you want to display. Then hit Enter to validate.
3. And again, press S and then 3 (or other smaller/bigger value) to set the auto-update time to every 3 seconds…. In order to view the whole device name (the complete naa identifier) you’ll have to enlarge the column pres Shift + L and enter “32”. (or other larger number).
What represents the different columns?
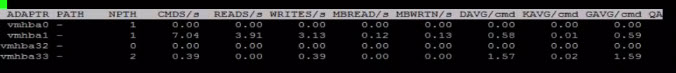
Now let’s start with ESXTOP utility by identifying the different columns.
CMDS/s – sum of commands per second with IOPS (Input/Output Operations Per Second). Here are also other SCSI commands like SCSI reservations, locks, vendor string requests, unit attention commands etc. All those are flowing to or are coming from the device or virtual machine which is monitored.
DAVG/cmd – Average response time in milliseconds per command which is sent to the device.
KAVG/cmd – How many time this command spend in the VMkernel.
GAVG/cmd – Response time at the guest operating system level. Here comes a formula: DAVG + KAVG = GAVG
So today we have seen different possibilities to monitor storage performance. Per VM, per LUN or per Disk (hba). The built-in utility ESXTOP is the tool which is bundled with ESXi, so it’s present on every ESXi installation. It is good to know how to get some storage numbers quickly.
Source: http://www.vladan.fr/