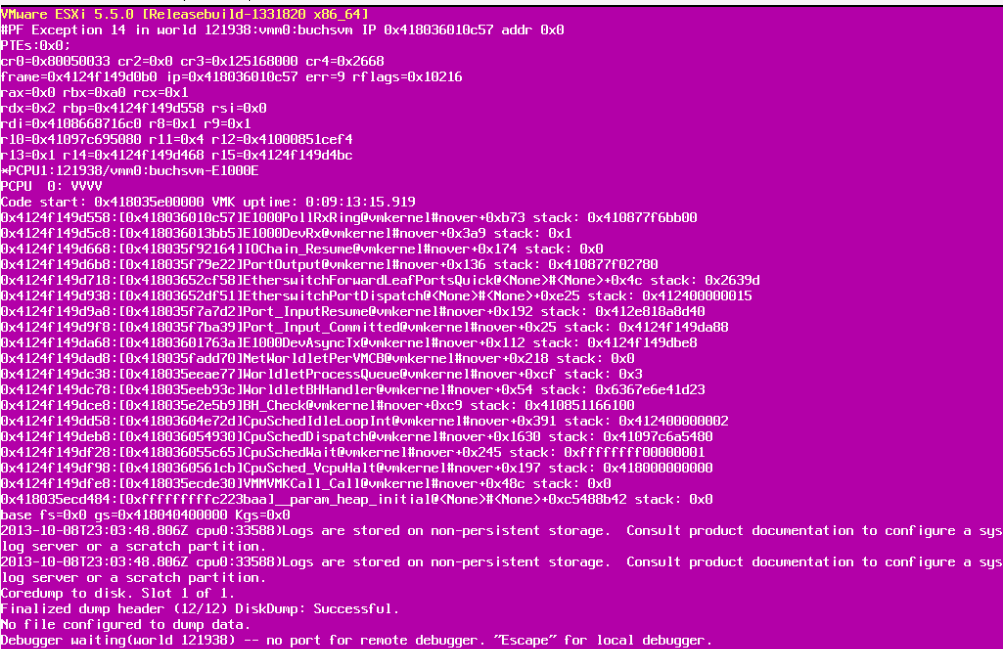
Question: How do you troubleshoot ESXi host PSOD problems?
Most of the Windows Administrators are familiar with Blue Screen of Death and it is time to know new term PSOD – Purple Screen of Death (VMware seems try to be unique by not using Blue color 🙂 )
Interviewer explain this as scenario based question:
I have a ESX 5.5 installed on my HP Proliant DL 180 G6 with a configuration of 8X Intel(R) Xeon(R) CPU E5540 @ 2.53GHz, 24 GB RAM
Recently the server has crashed four times, showing the Purple Screen of Death. Once this happens all of the virtual machines on the server stops and crashes until I restart this server.
Answer: You can start with definition of what is PSOD to impress him/her and followed by Troubleshooting steps
“A Purple Screen of Death (PSOD) is a diagnostic screen with white type on a purple background that is displayed when the VMkernel of an ESX/ESXi host experiences a critical error, becomes inoperative and terminates any virtual machines that are running”
You need to highlight important step to capture log file information after the PSOD occurred.
To resolve this issue, extract the log file from a vmkernel-zdump file using a command line utility on the ESX or ESXi host. This utility differs for different versions of ESX or ESXi.
- For ESXi 3.5, ESXi/ESX 4.x and ESXi 5.x, use the esxcfg-dumppart utility:# esxcfg-dumppart -L vmkernel-zdump-filename
To extract the log file from a vmkernel-zdump file:
- Find thevmkernel-zdump file in the /root/ or /var/core/ directory:# ls /root/vmkernel* /var/core/vmkernel*
/var/core/vmkernel-zdump-073108.09.16.1 - Use thevmkdump or esxcfg-dumppart utility to extract the log. For example:# vmkdump -l /var/core/vmkernel-zdump-073108.09.16.1
created file vmkernel-log.1# esxcfg-dumppart -L /var/core/vmkernel-zdump-073108.09.16.1
created file vmkernel-log.1 - Thevmkernel-log.1 file is plain text, though may start with null characters. Focus on the end of the log, which is similar to:
VMware ESX Server [Releasebuild-98103]
PCPU 1 locked up. Failed to ack TLB invalidate.
frame=0x3a37d98 ip=0x625e94 cr2=0x0 cr3=0x40c66000 cr4=0x16c
es=0xffffffff ds=0xffffffff fs=0xffffffff gs=0xffffffff
eax=0xffffffff ebx=0xffffffff ecx=0xffffffff edx=0xffffffff
Note: The file name created for the log in this example is vmkernel-log.1. If another file with the same name already exists, the new file is created with the number suffix incremented.
Most of the times it will be hardware issue and you need to open a case with Hardware vendors, in this case it is HP. Based on findings you need to replace the Hardware devices or upgrade the firmware as suggested by Hardware vendors via ITIL Change Management process.
In some cases it may be problem with software installed on ESXi server like additional agents for monitoring both software & hardware, additional VIBs added for Storage … etc
Finally if you want to be expert to analyze the logs on your own, then here is the good KB Article from VMware. It’s rare that Interviewer asking about debugging this issue but he wants to check your understanding about procedure followed in case of PSOD.
VMware KB1004250
Hope this information helps you to crack your Interview and share with others who need this real time scenarios.
Happy Learning and All the Best for your Interview.


